Price Change IndicatorPrice Change Indicator (PCI)
Version: 1.0
Author: LazyTrader 🚀
🔍 Overview
The Price Change Indicator (PCI) helps traders visualize and compare price changes between the current bar and the previous bar. It provides a customizable display of price changes in two formats:
Percentage (%) Change – Relative price movement.
Natural Change – Absolute difference in price units.
⚙️ Key Features
✅ Customizable Calculation Method: Choose how the price change is calculated:
Opening Price
Closing Price
High
Low
✅ Flexible Display Format:
Show Percentage (%) Change.
Show Natural (Absolute) Change in price.
✅ Adjustable Sensitivity with Multiplier:
100 (Standard Change)
1000 (Small Change)
10000 (Tiny Change)
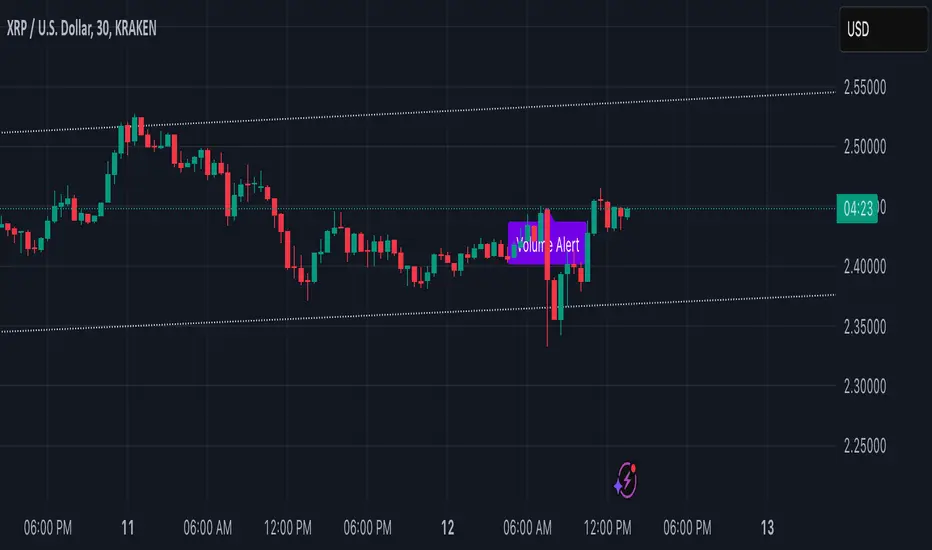
✅ Intuitive Labeling:
Green label (above bar) for increase.
Red label (below bar) for decrease.
No label if no change.
Large, easy-to-read labels for better visibility.
✅ Perfect for Any Market:
Stocks 📈
Forex 💱
Crypto 🚀
Commodities 🛢️
📊 How It Works
The indicator calculates the difference between the current and previous bar’s price based on your chosen method.
The result is displayed as either a percentage (%) or a natural price change.
If the price has increased, a green label is displayed above the bar.
If the price has decreased, a red label is displayed below the bar.
⚡ How to Use
Add the indicator to your chart.
Go to settings and customize:
Select calculation method (Open, Close, High, Low).
Choose display format (% or Natural Change).
Adjust multiplier for more sensitivity.
Analyze the labels to see price movements easily!
🔧 Settings Explained
Setting Description
Price Calculation Method: Choose Open, Close, High, or Low price for comparison.
Display Format: Show either % Change or Natural Change.
Multiplier: Apply 100, 1000, or 10000 to scale small price changes.
Show Labels: Toggle labels on/off.
🎯 Best Use Cases
🔹 Identifying strong price movements
🔹 Spotting trends and momentum shifts
🔹 Comparing price movement intensity
🔹 Works for scalping, swing trading, and long-term analysis
אינדיקטור Pine Script®